Sprinting
Sprint Training Log: What to Record and Why Video Proof Matters
A sprint log only helps if times can be compared. See what to record for every rep, why the timing method changes the number, and why video helps.
7 min read
Most long jumpers track one number: their season best. It goes in the results, it decides selections, and it is the jump everyone remembers. As a way to see whether your training works, it is a weak guide.
A season best is one jump out of maybe a hundred. It can come from a lucky board, a tailwind or one good day. To see real progress, you need a few more numbers from every session, measured the same way each time. This guide shows which numbers to log, how to measure them properly, and how to read them across a season.
Picture two jumpers who both have a personal best of 6.40 m. The first one lands between 6.30 and 6.40 in every session. The second one lands anywhere from 5.80 to 6.40 and fouls half of their attempts. On paper they are equal. In a final, the first jumper is far more likely to hit 6.40 again, and the second one has an obvious thing to fix.
A personal best also moves rarely. You might set one three times in a season, and nothing in between tells you whether you are on track. Tracking more than the best jump gives you something useful to look at after every single session.
Training numbers are only useful if they are measured the way a meet would measure them. The World Athletics Technical Rules for horizontal jumps are clear about how:
In training, people cut corners. Some pull the tape to the heel marks when the athlete sat back and touched the sand with a hand. That mark behind the heels is the one that counts, so the training number comes out longer than a meet would give. Others measure from the toe print on the board instead of the line. That is a useful number, but it is a different one, and it needs its own column.
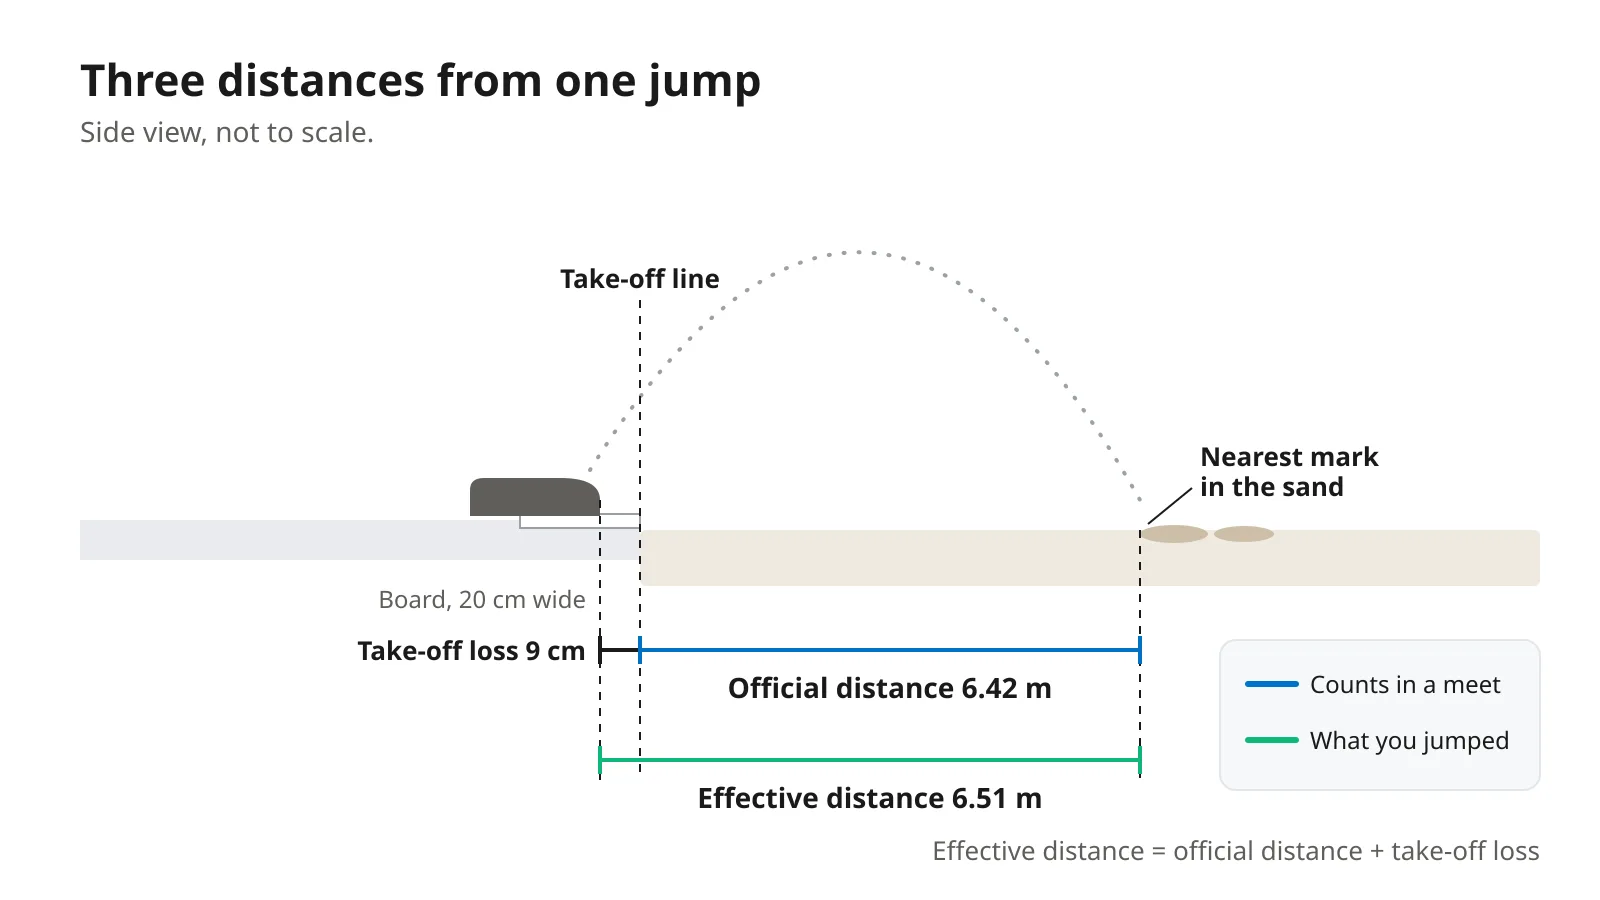
Every centimetre between your toe and the take-off line is lost. You jumped it, but it does not count. Biomechanists call it the take-off loss. Add it to the official distance and you get the effective distance: how far you really jumped, measured from your toe.
Even the best jumpers in the world lose real distance here. In the men's final at the 2017 World Championships in London, the World Athletics biomechanics report on the men's long jump measured an average take-off loss of 6 centimetres across the twelve finalists. Aleksandr Menkov lost 8 centimetres on his best jump. The report notes that cutting that to 2 centimetres would have won him the bronze medal.
The same report sums up the event in one line:
"To jump the longest distance, the athlete must have a large horizontal velocity at the end of the run-up and the foot placed as accurately as possible on the take-off board."
Tracking both distances tells you which half of that sentence to work on. If your effective distance is rising but your official distance is flat, your jumping is getting better and your board accuracy is not. If both are flat, the problem is speed or take-off, not the board.
Film the board from the side, with the phone level and in line with the take-off line. Under World Athletics rules the board is 20 centimetres wide, so you can use it as a ruler on screen. Find the last frame before the take-off foot leaves the board, and judge how far the tip of the shoe is from the line. A reading to the nearest few centimetres is enough to see a pattern over a session.
Log fouls too, with a rough guess at how far over you were. A jumper who fouls by 2 centimetres and one who fouls by 15 have very different problems.
A short-approach jump from 8 strides and a full-approach jump from 18 strides should be tracked as two different things. Short approaches are slower, so they land shorter. Put them in the same chart and every technique session looks like a bad day. Keep them apart, and write down the number of strides and your start mark each time.
The run-up is also where much of your consistency comes from. In a classic study of long jumpers, Lee, Lishman and Thomson found that jumpers run a fairly fixed stride pattern for most of the approach. Then they adjust their strides in the last few steps, steering by eye toward the board. That is why your board number moves from jump to jump even when your start mark stays put. A side-on clip of the last strides shows whether you adjust smoothly or chop your steps at the end.
Wind changes jumps just as it changes sprints. In competition, World Athletics measures it for 5 seconds from the moment the jumper passes a mark 40 metres from the take-off line. If the average tailwind is more than 2.0 metres per second, the jump cannot count as a record.
You probably do not have a wind gauge at training, and that is fine. Write down head, tail or cross, and light or strong. Over a season, that is enough to explain why one session looked so much better than another.
Here is a simple set of fields that covers it. Log one row per jump, every jump, not just the best one.
| Field | Example | Why it matters |
|---|---|---|
| Date and session | 12 May, technique session | Links the jump to what you did that day |
| Approach | Full, 18 strides | Keeps short and full approaches apart |
| Official distance | 6.42 m | The number a meet would record |
| Take-off loss | 9 cm | Shows what the board cost you |
| Effective distance | 6.51 m | Shows how far you really jumped |
| Foul | No | Fouls tell you about your run-up |
| Wind | Light tailwind | Explains good and bad days |
| Video | Side-on clip of the board and the landing | Lets you or a coach check the numbers later |
| Note | Last two strides felt short | What the numbers cannot tell you |
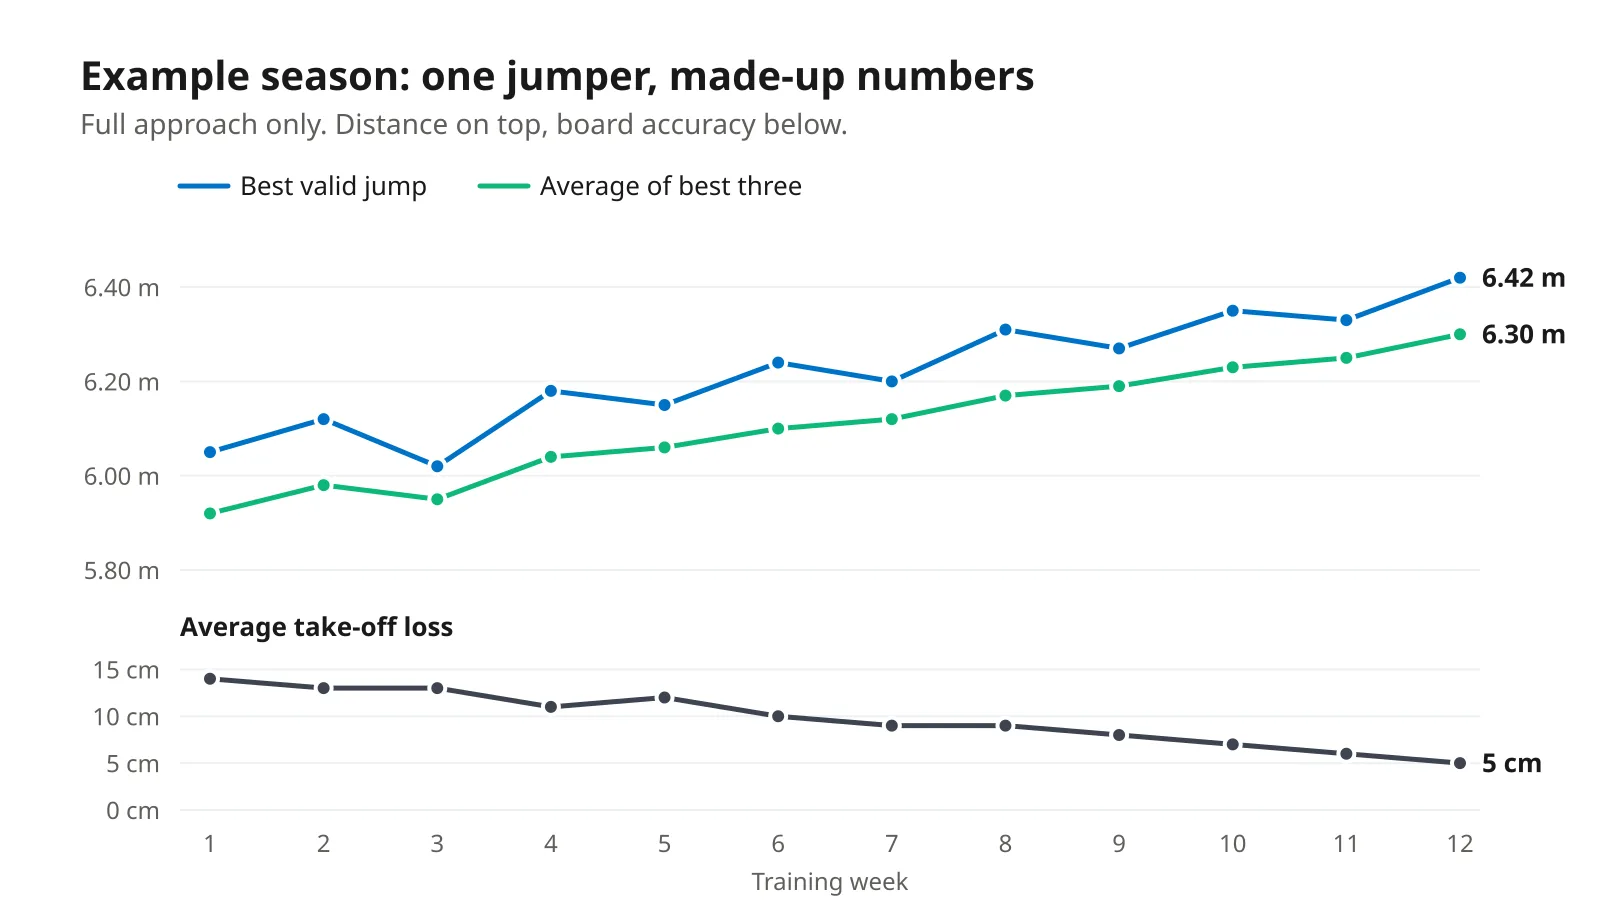
After a few weeks of logging, look at three lines instead of one:
Compare like with like: full approach with full approach, similar wind, the same point in the training week. And give it time. From one session to the next, the numbers bounce around. Over a training block of several weeks, a real trend shows through the noise.
A log full of numbers is only as good as the person holding the tape. Distances measured in a hurry, by a different teammate each week, drift. A short clip of each jump fixes a lot of that. You can check the board, see where the nearest mark really was, and spot the jump where the number does not match what happened.
Video also lets you compare technique with the result attached. Put a 6.20 m jump and a 6.45 m jump side by side, filmed from the same spot, and you can see what changed. Maybe it was speed onto the board, the last two strides or your position at take-off. A number alone cannot show you that.
This is the gap Sploore is built to fill. Each jump is logged as a result with the distance, the date and the clip together. Your progress chart is then made of jumps you can watch again, and old attempts no longer get lost in a camera roll.
The long jump is a sprint that ends in a jump, and your speed at the end of the run-up sets your ceiling. If your effective distance has stalled, a top-speed test tells you whether the runway is the limit. Our guide to the flying 30m sprint test with phone video shows how to measure it. For the rest of your sessions, our post on what to record in a sprint training log covers the same habits for your running work.
Start with your next session: measure every jump, note the board and the wind, and film from the side. If you want those jumps and their clips in one place, with a chart that builds itself, try logging them in Sploore.
Your journey. Your progress. Track what matters to you.
Download SplooreA sprint log only helps if times can be compared. See what to record for every rep, why the timing method changes the number, and why video helps.
7 min read
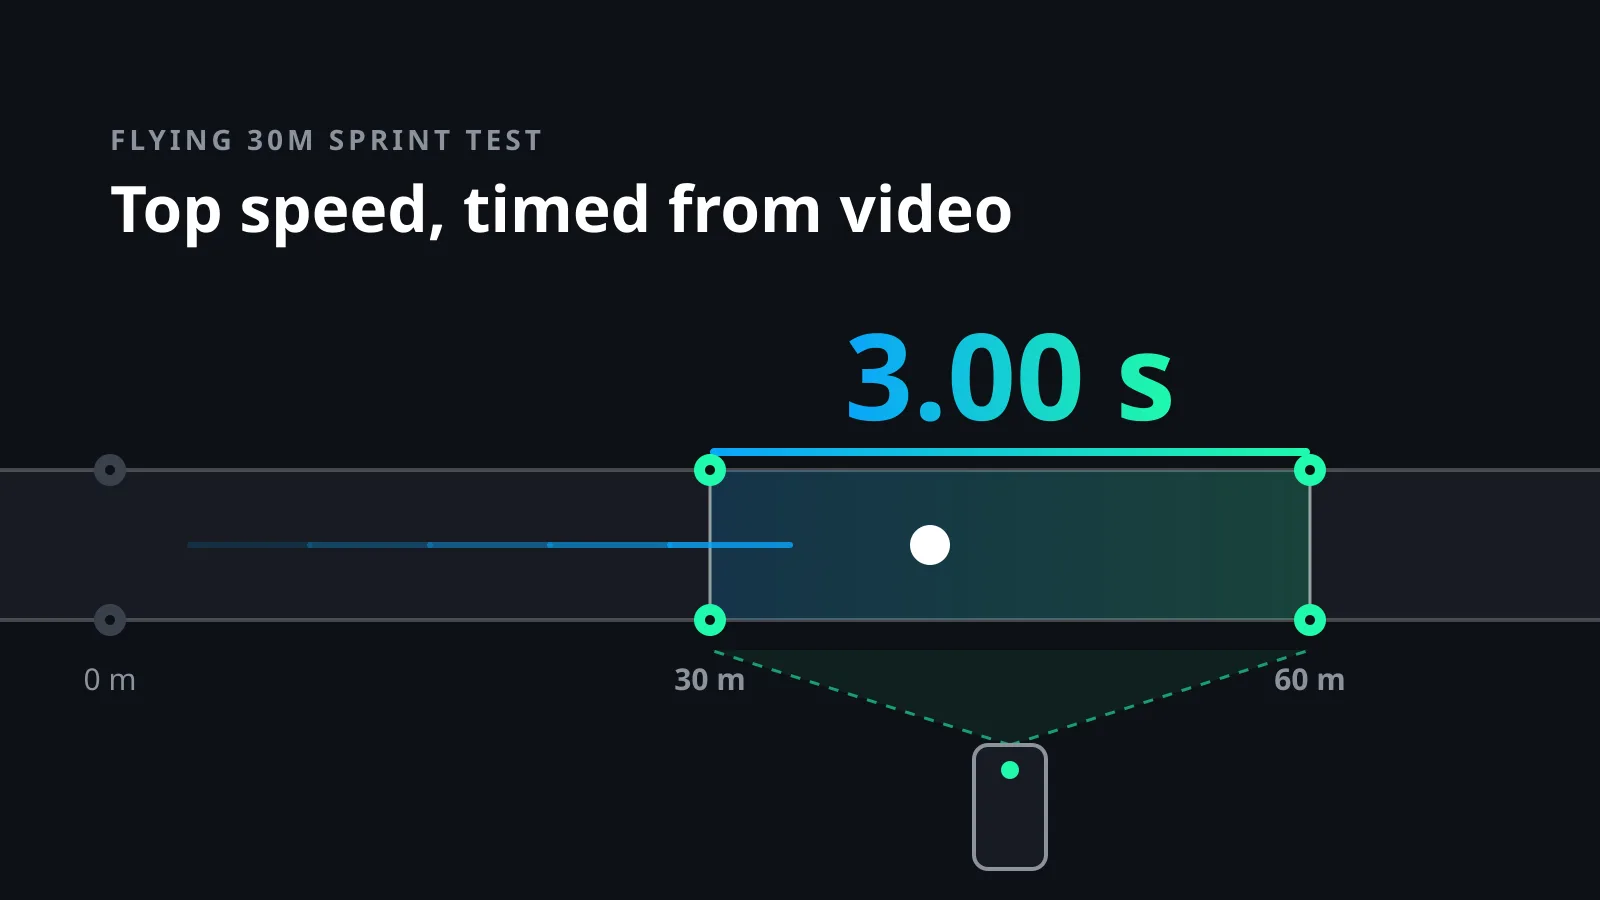
Set up a flying 30m sprint test, time it from phone video to the hundredth, and avoid the camera mistake that quietly adds a metre to every run.
10 min read
Workout videos get ignored because they show a moment, not progress. Here is why training clips get low views, and how measurable results change that.
3 min read